
Introduction: Why Inflation Matters
Inflation is one of the most powerful — and misunderstood — forces in investing. It quietly erodes purchasing power, reshapes economic incentives, and redistributes wealth between borrowers and lenders. For long‑term investors, inflation is not just a macroeconomic statistic reported once a month; it is a central risk factor that determines real (after‑inflation) returns.
In strategies inspired by all‑weather or risk‑parity principles, inflation plays a structural role. Different assets respond very differently depending on why inflation is rising. A portfolio that performs well during growth‑driven inflation may struggle badly during supply‑driven inflation — and vice versa.
This article answers a deceptively simple question:
What causes inflation?
Using long‑term U.S. data (1986–2025), we will examine the empirical drivers of inflation and connect them to economic theory, real‑world regimes, and practical portfolio construction. The goal is not to predict inflation perfectly — that is impossible — but to understand the mechanisms well enough to prepare a portfolio.
What Is Inflation? A Practical Definition
Inflation is the sustained increase in the general price level of goods and services over time. In practice, it is most commonly measured using the Consumer Price Index (CPI), which tracks the cost of a representative basket of goods and services consumed by households.
Two distinctions are important for investors:
- Nominal vs real values
Nominal returns are reported before inflation. Real returns adjust for inflation and reflect changes in purchasing power. - Expected vs unexpected inflation
Markets often price in expected inflation. It is unexpected inflation — especially sudden regime shifts — that tends to cause the most damage to traditional portfolios.
Understanding why inflation is rising helps determine whether it is likely to persist, accelerate, or reverse — and which assets are likely to benefit or suffer.
A Data‑Driven View: What Has Historically Driven Inflation?
To ground the discussion in evidence, we examine quarterly U.S. data from January 1986 to June 2025, focusing on variables and how they interact with inflation:
- Consumer Price Index (CPI)
- Gross Domestic Product (GDP)
- WTI crude oil prices
- M2 money supply
- Fed Funds Rate
Each series is converted to annual percentage change (except for the Fed Funds Rate, where we use the absolut change in percentage points) and tested for correlation with CPI.
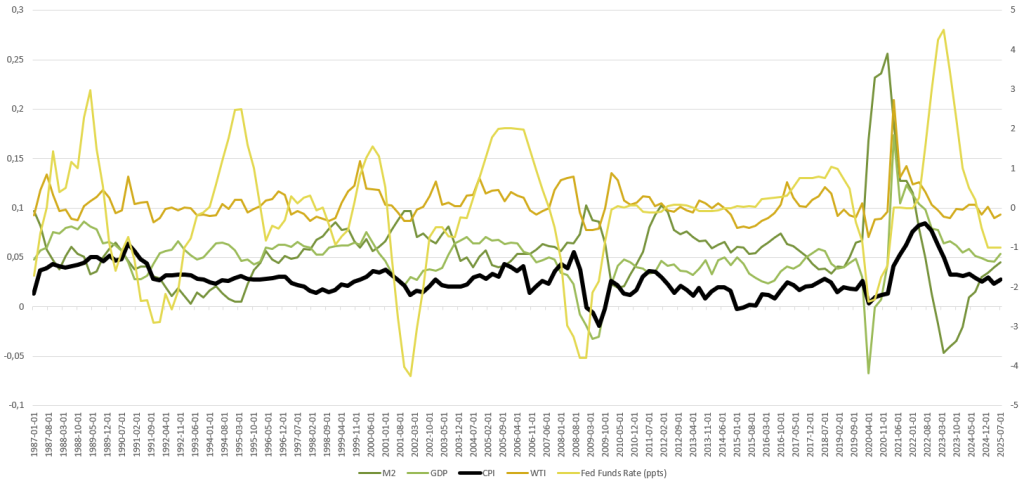
Some relationships might be visible from just looking at the above chart. We can decipher that M2 rose sharply in 2020 and WTI in 2021, followed by higher inflation in 2021-2022.
We can also see how GDP growth in 1997-1999 drove inflation upward, while the decline in 2000 caused inflation to follow downward in 2001. A similar relationship was visible in 2009.
While we might see some relationships just looking at the lines The relationships may be easier to determine via a correlation matrix:
| M2 | WTI | GDP | Fed Funds Rate | CPI | |
| M2 | 1 | 0.0839 | -0.1850 | 0.4333 | -0.2072 |
| WTI | 0.0839 | 1 | 0.5327 | 0.1604 | 0.4883 |
| GDP | -0.1850 | 0.5327 | 1 | 0.4877 | 0.6007 |
| Fed Funds Rate | -0.4333 | 0.1604 | 0.4877 | 1 | 0.2742 |
| CPI | -0.2072 | 0.4883 | 0.6007 | 0.2742 | 1 |
These numbers show many weak relationships. For example, we know that M2 is not inversely affecting inflation. No, there is something else that needs explaining. Namely, there is often a lag from a inflation-driving factor happening until it is read in a CPI print. In the next step of the analysis, we will thus need to offset some factors to show their true explanatory powers.
Next, we review the same chart and dataset, but with different time lags on M2, WTI, and GDP. Here, the relationships are much easier to see. For example, we have shifted the M2 line by 1.5 years, whereafter we can much more clearly see that it moves in tandem with inflation.
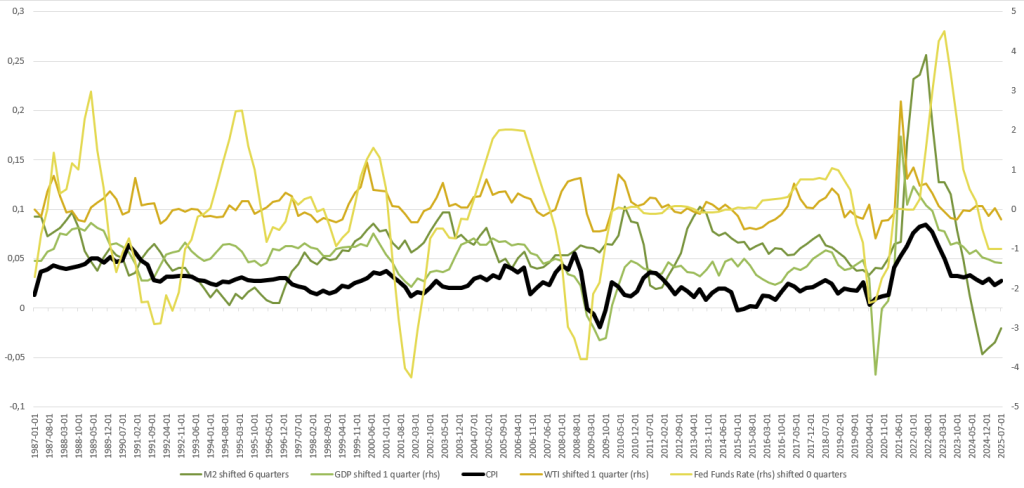
We can clearly see that the relationship with CPI grows stronger for all of these factors, meaning that they all have an impact on inflation, but that they are frontrunning inflation. There is a cause-effect relationship.
This is, however, not the case for the Fed Funds Rate, which has the strongest correlation on its unlagged series, meaning that the Fed might be better at reacting to inflation rather than anticipating it.
| M2 | WTI | GDP | Fed Funds Rate | CPI | |
| M2 | 1 | 0.2876 | 0.3121 | 0.1802 | 0.3870 |
| WTI | 0.2876 | 1 | 0.5341 | 0.1418 | 0.5071 |
| GDP | 0.3121 | 0.5341 | 1 | 0.4996 | 0.6656 |
| Fed Funds Rate | 0.1802 | 0.1418 | 0.4996 | 1 | 0.2742 |
| CPI | 0.3870 | 0.5071 | 0.6656 | 0.2742 | 1 |
As for explanatory power, let’s review the R-squared measures for these indicators. This tells us that the change in GDP explains about 44% of inflation 1 quarter later. WTI also leads inflation with 1 quarter and explains about 26% of changes in inflation. M2 is not the greatest influencer of inflation rate, but a change in M2 will explain about 15% of inflation 1.5 years later when the increased money supply has started to spread within the system.
| M2 | WTI | GDP | Fed Funds Rate | |
| r2 | 0.1498 | 0.2571 | 0.4431 | 0.0751 |
Key empirical findings
- GDP growth (1‑quarter lead) shows the strongest relationship with inflation, with a correlation of 0.66.
- WTI oil prices (1‑quarter lead) show a strong correlation of 0.50.
- M2 money supply (6‑quarter lead) has a weaker but still meaningful correlation of 0.38, implying a roughly 18‑month lag between monetary expansion and inflation.
- Fed Funds rate (without lag) had a weaker relationship with the change rate of inflation with a correlation of just 0.27. It actually has a stronger relationship with GDP growth, with a 0.50 correlation.
These results already tell us something crucial:
Inflation is rarely caused by a single factor. It is the result of interacting forces that operate on different time horizons. This is also why none of the factors have a perfect explanatory power.
To understand inflation properly, we must separate it into distinct types.
The Three Core Types of Inflation
Let’s quickly review the three core types of inflation. For a more in-depth understanding, I recommend my separate article on this subject, which you can find here on the blog.
1. Demand‑Pull Inflation
Demand‑pull inflation occurs when aggregate demand in the economy grows faster than productive capacity.
In simple terms: too much money chasing too few goods, which drives up prices.
How it works
- Strong economic growth increases employment and wages
- Households spend more
- Businesses gain pricing power
- Prices rise across a broad range of goods and services
What the data shows
The strong correlation between GDP growth and CPI supports this mechanism. When economic output accelerates, inflation often follows with a short lag.
This is the most benign form of inflation. It usually coincides with rising corporate profits and healthy balance sheets.
Typical triggers
- Fiscal stimulus
- Credit expansion
- Technological diffusion boosting income
- Post‑recession recoveries
Asset behavior
- Equities and real estate tend to perform well
- Credit performs well as defaults remain low
- Commodities may rise modestly
- Bonds struggle as yields rise
2. Cost‑Push (Supply‑Driven) Inflation
Cost‑push inflation originates on the supply side of the economy.
Prices rise because the cost of production increases, not because demand is booming. This is a case when WTI Oil prices cause inflation.
How it works
- Input prices (energy, raw materials, labor) rise
- Firms pass higher costs to consumers
- Real incomes fall
- Growth slows or contracts
What the data shows
The correlation between oil prices and CPI, even with a short lag, highlights the importance of energy as a foundational input. Energy affects transportation, manufacturing, agriculture, and services simultaneously. This type of inflation was contributing in the 2020s with supply chain disruptions, as well as in the 1970s with oil shocks.
Typical triggers
- Oil shocks
- Geopolitical conflicts
- Supply chain disruptions
- Trade barriers and tariffs
- Climate‑related shocks
Asset behavior
- Equities struggle due to margin compression
- Commodities (especially energy) perform well
- Inflation‑linked bonds outperform nominal bonds
- Traditional bonds perform poorly
This is often the most painful inflation regime for traditional 60/40 portfolios.
3. Monetary (Policy‑Driven) Inflation
Monetary inflation results from sustained expansion of the money supply beyond the economy’s real growth capacity.
How it works
- Central banks expand liquidity
- Asset prices rise first
- Consumer prices rise later
- Currency purchasing power erodes
What the data shows
The long lag between M2 growth and CPI is crucial. Monetary inflation is slow‑burning. It often shows up first in asset markets (stocks, real estate) before appearing in consumer prices. This is the main type of inflation we have seen in the 2020s.
This explains why inflation can remain low for years despite aggressive monetary easing — until it suddenly does not.
Typical triggers
- Prolonged zero‑rate policies
- Quantitative easing
- Monetization of fiscal deficits
Asset behavior
- Real assets outperform
- Nominal bonds perform poorly
- Cash loses purchasing power
- Gold tends to perform well
Other Structural Drivers of Inflation
While the three categories above explain most inflation episodes, several structural factors influence inflation dynamics over longer horizons.
Demographics
- Aging populations reduce demand and inflationary pressure
- Younger populations increase consumption and housing demand
Globalisation vs de‑globalisation
- Globalization suppressed inflation through labor arbitrage
- De‑globalization increases costs and redundancy
Productivity growth
- High productivity offsets wage inflation
- Weak productivity amplifies inflation pressures
Fiscal dominance
- Large government deficits increase inflation risk if monetized
These forces evolve slowly but shape the background inflation regime.
How Investors Can Read Inflation Data
Retail investors do not need complex models to build intuition about inflation. Instead, you just need to keep an eye out for a couple of leading indicators to get a decent understanding of what trend to expect in the inflation prints.
Leading indicators to watch
- GDP growth trends
- Energy and commodity prices
- Money supply growth
- Wage growth
- Inflation expectations
Interpreting lags
- Growth shocks tend to affect inflation quickly
- Commodity shocks transmit within months
- Monetary effects take 12–24 months
The key is not precision but directional awareness.
Portfolio Implications: Inflation Through a Risk Parity Lens
Risk parity portfolios allocate capital so that each asset contributes roughly equal risk rather than equal capital. This distinction is crucial. Assets differ dramatically in volatility: equities are inherently much riskier than government bonds, while commodities and gold can experience sharp drawdowns over short periods. A traditional capital‑weighted portfolio (for example 60/40) therefore concentrates most of its risk in equities, even if bonds represent a large share of the capital.
Risk parity approaches seek to balance these risk contributions. The result is a portfolio that is not dependent on a single economic outcome — such as strong growth with low inflation — but instead aims to remain resilient across multiple inflation regimes.
From an inflation perspective, this framework is especially powerful because different assets respond to different causes of inflation, not just different inflation levels.
Why inflation regimes matter for portfolios
Inflation is not binary (high vs low). The source of inflation determines whether it is supportive or destructive for financial assets:
- Inflation driven by strong demand and growth is generally positive for corporate earnings
- Inflation driven by supply shocks erodes margins and real incomes
- Inflation driven by monetary expansion undermines currency value and long‑duration claims
A risk‑parity portfolio does not try to guess which regime will prevail. Instead, it holds assets that can respond positively — or at least defensively — in each scenario.
Asset roles under inflation (with intuition)
- Equities
Equities are claims on real business activity. They tend to perform best during demand‑driven inflation, when revenues grow faster than costs and pricing power is strong. However, equities are vulnerable to supply‑driven inflation and rising discount rates. - Commodities
Commodities sit at the source of many inflation shocks. Energy, industrial metals, and agricultural goods often rise sharply during cost‑push inflation, making commodities one of the most direct inflation hedges. Their volatility is high, which is why their capital weight is usually modest. - Inflation‑linked bonds
Inflation‑linked bonds (such as TIPS) adjust principal and coupons with realized inflation. They are most effective against unexpected inflation, particularly when inflation rises faster than markets had priced in. They offer lower volatility than commodities but weaker protection against extreme supply shocks. - Nominal bonds (long duration)
Nominal government bonds perform best during disinflation or deflation, when growth slows and yields fall. Although they suffer during inflationary periods, they play a crucial stabilizing role in portfolios by providing convexity during recessions and crises. - Gold
Gold is best understood as a hedge against monetary and currency‑driven inflation. It does not depend on cash flows or economic growth and tends to perform well when real interest rates are negative or when confidence in fiat currency erodes.
Each asset addresses a different failure mode of the economic system.
Illustrative long‑term risk‑balanced allocation
An example of a long‑term, risk‑balanced allocation designed to handle multiple inflation regimes might look like this:
- Equities: ~30%
- Nominal bonds (long duration): ~35%
- Inflation‑linked bonds: ~10%
- Commodities: ~10%
- Gold: ~15%
These weights should not be interpreted as fixed or optimal for all investors. In practice, risk parity allocations are adjusted based on:
- Asset volatility
- Cross‑asset correlations
- Leverage constraints
- Investment horizon and drawdown tolerance
The key insight is that inflation protection emerges from diversification, not from betting on a single asset class. By spreading risk across assets that respond differently to demand‑pull, cost‑push, and monetary inflation, investors reduce reliance on accurate forecasts and increase portfolio robustness.
For an easy access to an All-Seasons Portfolio with built-in inflation protection, you can also check out and copy my eToro profile. I have been a Popular Investor on eToro since 2020, investing with an all-weather framework.
Why Forecasting Inflation Is Hard — and Often Unnecessary
Inflation forecasting suffers from:
- Structural breaks
- Policy regime changes
- Behavioral feedback loops
Rather than attempting precise forecasts, robust portfolios prepare for multiple outcomes.
This philosophy aligns with the principle:
You cannot predict, but you can prepare.
Conclusion: Understanding Inflation as a Regime, Not a Number
Inflation is not a single phenomenon. It is a family of outcomes driven by economic growth, supply, money, and policy.
By understanding why inflation rises — and how different assets respond — investors can design portfolios that remain resilient across regimes.
The goal is not to eliminate inflation risk, but to diversify it.
That is the essence of all‑weather investing.


