Simplified Portfolio Tracker (Google Sheets)
€ 15
Keep track of your portfolio and get signals of when it is time to rebalance it with this easy-to-use tool. This Google Spreadsheet file allows you to keep track of a portfolio with support of up to 10 assets. Get key details of your portfolio such as volatility, covariance matrix, Sharpe ratio, and expected return for the past 12 months.
In addition thereto, you get a a dashboard of the most important economic data in one tab, in a easily accessible format. You will find data of
- Your assets’ performance
- Stock index data
- Inflation and growth rates of key economies
- US Treasury yields and their developments
- Data for 12 important Commodities
![]()
![]()
Description
Simplified Portfolio Tracker Spreadsheet
The main functions of the simplified Portfolio Tracker come in two parts:
i) Portfolio tracker
ii) An economic dashboard
Portfolio Tracker (second tab)
In the Portfolio tab, you can keep track on your portfolio allocations and get reminders when it is time to rebalance your portfolio.
After you have entered your tickers and aimed allocations, based on the amount you enter in Account Balance cell, you will receive a suggested number of units to purchase to reach your aimed allocation based on your portfolio amount. The sheet has built-in support for ETFs denominated in several currencies, and the Aimed Hold Amount column is based on the ETF’s/asset’s trading currency, while Hold Value and Unit Price (EUR) columns automatically convert unit prices to EUR. All allocation percentages are based on EUR.
In the Monthly Savings column, you will receive advise on where to add funds, based on the Monthly Savings amount you stipulate in the corresponding cell.
The Rebalancing sensitivity steers the Rebalancing during the year column and is a measure of how much any asset is allowed to deviate from its aimed allocation before you should rebalance the portfolio on an ad hoc basis, i.e., in addition to scheduled rebalancing (annually, semi-annually or quarterly, etc.).
Economic Dashboard (first tab)
The Dashboard tab gives you a quick overview of several elements:
i) Your portfolio and the performance of it, based on the current composition
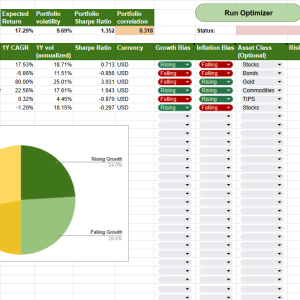
ii) Key portfolio data including expected return, volatility, Sharpe ratio, and VAR, compared against the S&P 500 and a 60/40 portfolio
iii) Latest inflation rates and GDP growth rates of select key major economies
iv) Historical data of certain stock markets/indexes, and EUR/USD and BTC/USD exchange rates
v) US Treasury yields of various terms, together with interest rate expectations and inflation expectations
vi) Historical prices of 12 important commodities, together with 3 key commodity indexes.


Reviews
There are no reviews yet.